Performance Testing
| What is Performance Testing | |
| Types of Performance Testing | |
| Metrics | |
| Tools |
What is Performance Testing
Types of Performance Testing
Metrics
Software is designed to be used for a specific purpose.
End-users expect certain performance in terms of quality, stability etc.
One of the goals of Performance Testing is to specify what type of usage software is
meant to support by providing quantitative metrics.
Example: some app can promise to work without any issues for maximum of ten simultaneous users.
What exactly is «without any issues» and what will happen if there are eleven users at the same time -
these are the questions Performance Testing aims to answer.
To provided universally understandable answers Performance Test should use specific metrics. Most common are:
- Average response time
- Peak response time
- Percentiles
- Average response time to Percentile ratio
- Standard Deviation
- Error Rate
- Hardware Resourse Consumption
Average Response Time
Average response time should be less that X seconds.
X should be defined based on Software users tolerance to response time.
For some types of software 5 seconds is somehow acceptable, for another 0.5 seconds is
a nightmare
Average response time is not good enough by itself.
It can hide significant and totally unacceptable delays for some users.
We will consider additional metrics and some of them will be based on average
response time, so it should be calculated anyway
Peak Response Time
Peak response time is the longest response time.
It can point to problems that will not be noticed with
other metrics, especially when significant data are collected.
Percentiles
90th , 95th, 99th Percentiles and other Percentiles are a first step
from ART to more informative metrics.
The % of requests you can tolearate to have longer delay should be defined as well.
It means that you should provide some percentile and its value.
For example: 99% of requests should have response time below X sec
If there is motivation from UX or technical perspective
percentiles other than 90th , 95th and 99th can be used.
Percentiles to Average response time ratio
Indicates the stability of the application if the ratio of average response time and e.g. 90th percentile is constant
Response Time Standard Deviation
Measure of how much response of a particular request is dispersed from the mean of set of response time.
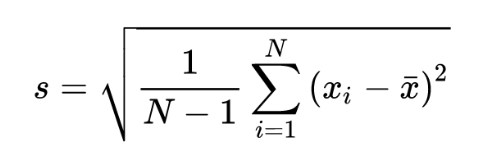
where { x1, x2, … , xN } are the measured response times. x- is the average response time. N is number of requests
Error Rate
% of requests that do not respond should be defined.
For example we can promise that the error rate should be below Y%
Hardware Resource Consumption
Set the limits in CPU, Memory and Disk usage in % that you consider acceptable at Peak Load and at some specific loads e.g. at 100 req/s to specific endpoint.
Hit-based
Scenario-based
Select an endpoint and provide load to it
Scenario-based
Record or fetch from logs typical user scenarios and provide load according to them. Keep typical user behaviour as it is, including waiting time. (Average users scenario)
Modify user scenarios to reduce waiting time. (Hyperactive users scenario)
Tools
- Кодирование — разработка и анализ кода, инструменты контроля версий, слияние кода;
- Сборка — инструменты непрерывной интеграции, статус сборки;
- Тестирование — инструменты непрерывного тестирования, обеспечивающие быструю и своевременную оценку бизнес-рисков;
- Упаковка — репозиторий артефактов, предварительная установка приложения;
- Релиз — управление изменениями, официальное утверждение выпуска, автоматизация выпуска;
- Настройка — конфигурация и управление инфраструктурой, Инфраструктура как инструменты кода;
- Мониторинг — измерение производительности приложений, взаимодействие с конечным пользователем.
Article author: Andrei Olegovich